Drying of Ceramic Shells – The Practice
Introduction
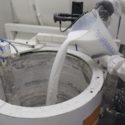
Following on from the first article on drying technology, this article outlines experimental work carried out within our lab into drying characteristics of a shell system under controlled conditions. One backup slurry system was used in this trial. That slurry is outlined within Table 1 below.
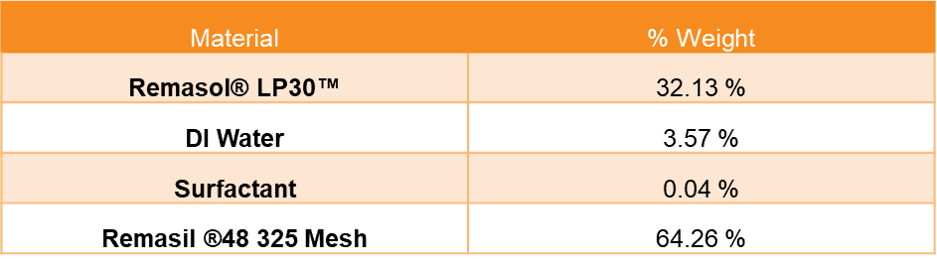 Table 1 – Slurry Recipe
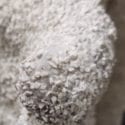
The stucco used was Remasil® 48 RG40. The conditions during dipping can be found within Table 2.
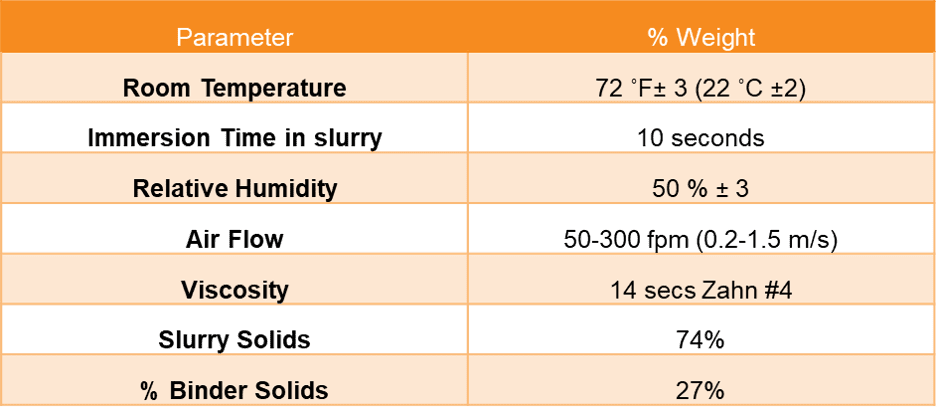 Table 2 – Build Parameters
A relative humidity of 50% was chosen, as this was felt to be representative of what is used in industry. Three 12-inch oscillating fans were used to aid in drying. One of the fans was used to help insure consistent temperature and R.H. by aiming it toward the ceiling. The other two were aimed at the drying samples and were placed approximately four to six feet away.
The US R&D lab has a separate drying room (dimensions: 10 feet wide x 16 feet long x 8 feet high) with a Cargocaire model HC-300 mounted on the roof. There are two sets of drying racks along the long walls. For this experiment, it was decided not to have the fans blow on the sample bars 100% of the time, because this rarely would happen in a typical foundry. Instead, the fans were set to have direct air flow on the samples for about 25-30% of the fans’ oscillation cycle. Because of the small size and open configuration of the samples, over drying of the samples was minimised. Obviously, the different drying conditions would shift the end results one way or the other.
Five different dry times (between dips) were chosen. A total of 60 modulus of rupture (MOR) bars were made, and the test was run as follows:
- 12 bars each were dipped at one, two, four, eight, and twenty-four hours dry time between dips
- Five dips plus a sealcoat were applied
- At 12 hours after the seal was applied, six bars from each set of 12 were taken for testing
- The edges were sanded off, and half the bars were immediately tested for green strength
- The other half were placed into a small box oven taken from room temperature to 1800°F (980°C) and held there for two hours.
- At 24 hours final dry, the same procedure was followed on the remaining six bars of each set
- The fired bars were tested as soon as possible after they were cool.
- Testing of the green bars and firing of the other bars was usually accomplished within one half to one hour after reaching the final dry time.
The 3-point MOR formula is given below:
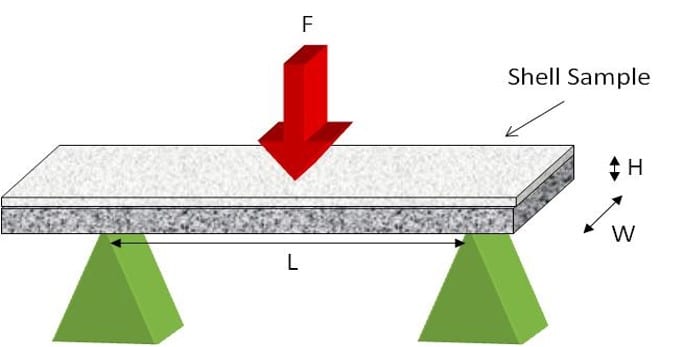
 where is the fracture load, L, W and H are the length, width and thickness of sample fracture area respectively.
RESULTS AND DISCUSSION
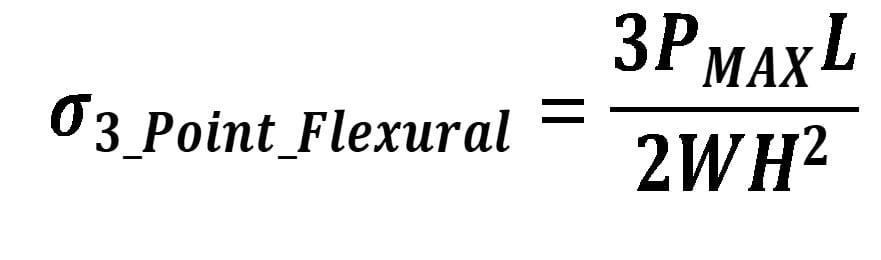
The average modulus of rupture results for the samples with 12 hours final dry time are shown in figure 1.
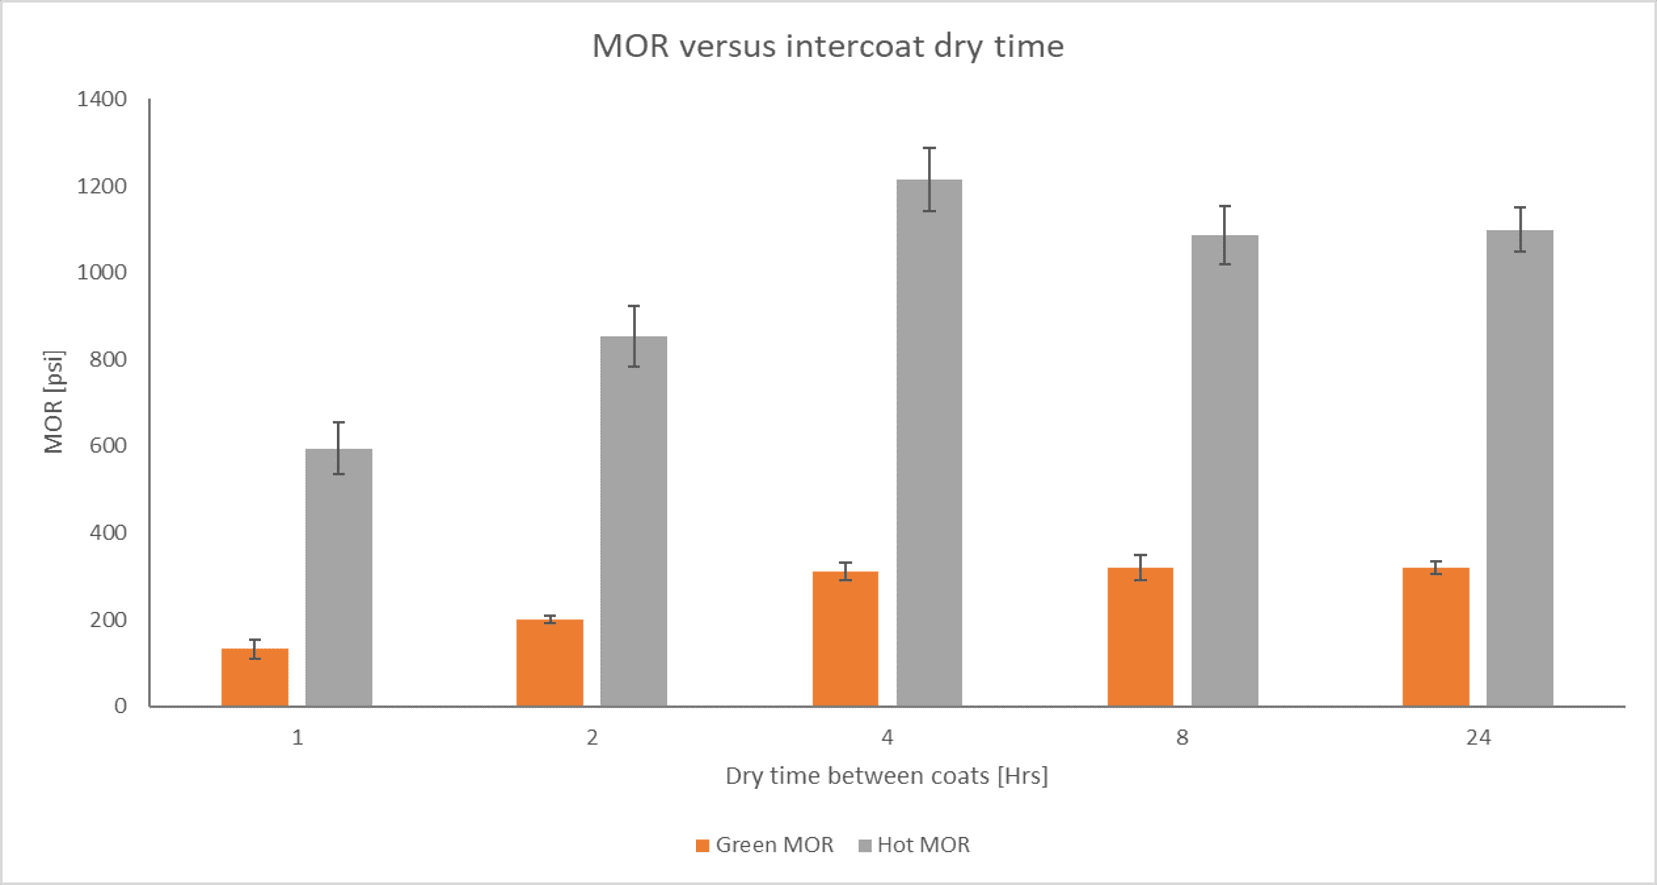 Figure 1 – MOR Versus inter coat Dry Time
It can be seen from the green MOR results, that green strength reached a virtual maximum at four hours dry time between dips. The same results were obtained with the fired MOR. Figure 2 shows the average percent difference of the 12-hour final dry bars using the four hour dry as the control. While there was virtually no difference between four, eight or 24 hours dry with regards to MOR strength, the one and two hour dry samples showed much lower strengths.
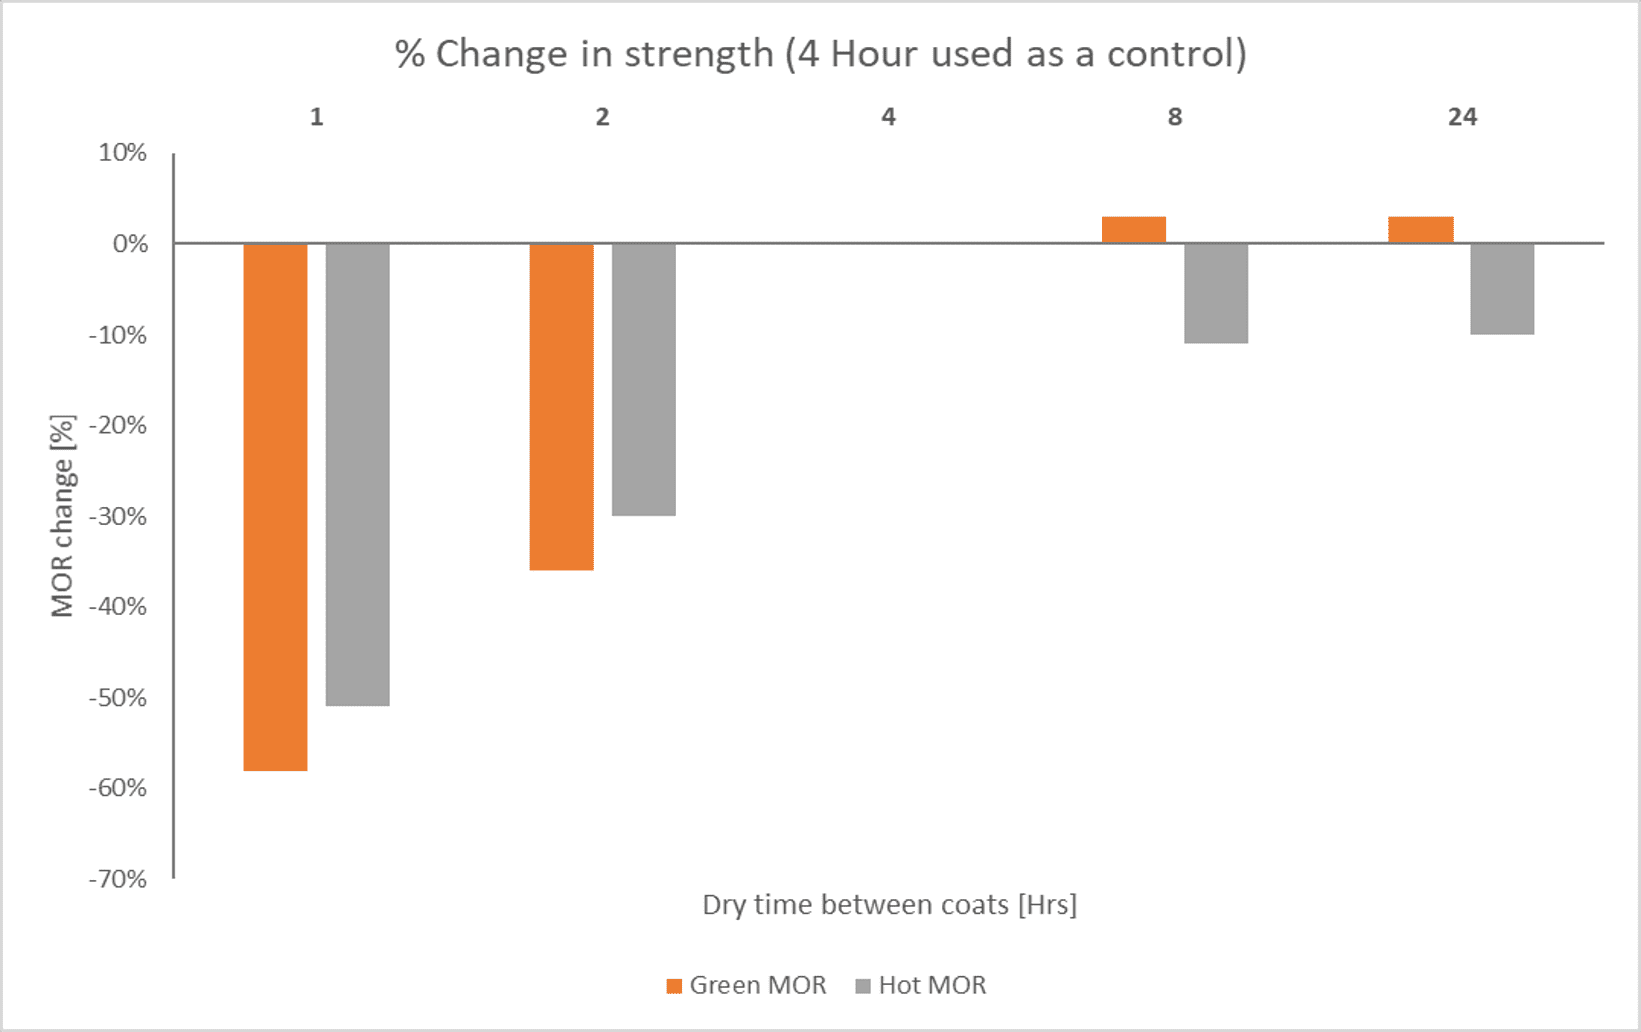 Figure 2 – Percentage change in strength versus a 4-hour control
These samples were obviously not dry, so their maximum bonding strength was not achieved. Figure 3 helps to show this. (Figure 3 basically follows the drying of one of the four hour sample bars on third and fourth dips until a constant weight was reached. It should be noted that reaching a constant weight is not the same as completely drying the mold.) Since we are making the assumption that the drying rate was constant for all the samples, the one and two hour samples should correspond to this curve. Looking at the 60-minute values, it can be seen that there is a significant amount of water left in the samples (1.9 grams divided by 5.2 grams = 36.5%). At two hours, the samples are still not dry (approximately 0.6 grams moisture left, or 11.5% of the original amount).
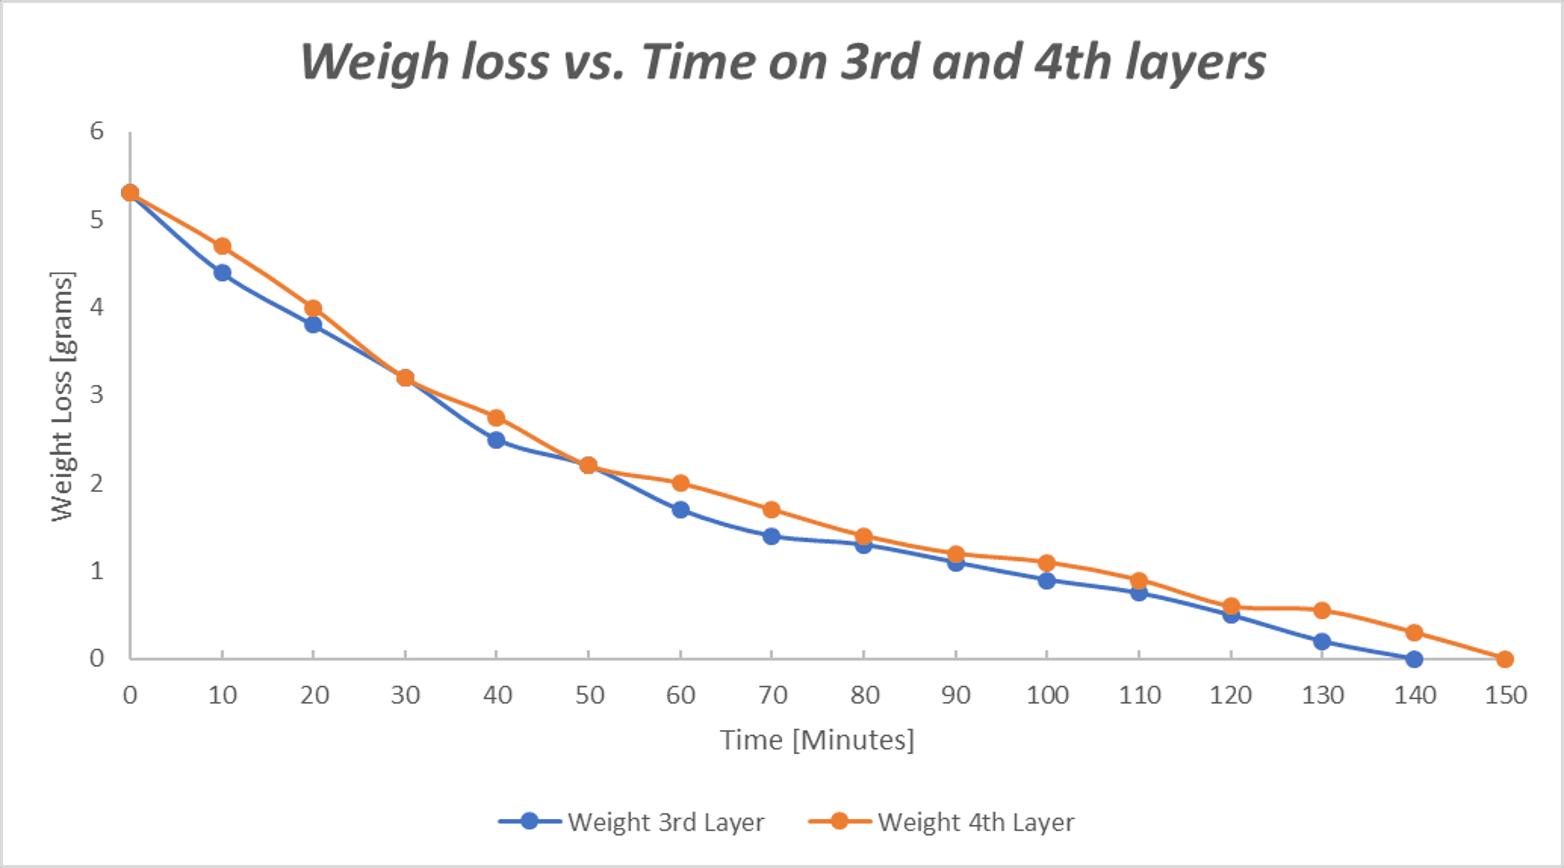 Figure 3 – Weight Loss versus Time on 3rd and 4th layers
This helps to explain why both sets of bars (one and two hours) had such lower strengths than the others, and why two hours produced greater strength over one hour. Based on the data in Figure 3, it might be conjectured that a three hour dry time might be enough to achieve optimum bonding given the same drying conditions. However, it should be noted that the dry times on successive dips will probably be somewhat extended, just as it took ten minutes longer to dry the fourth layer. (Other more complex configurations would probably extend the dry time out much more than ten minutes.) Looking at the average MOR results for the 24 hour final dry samples (Figure 4), the same trend that occurred with 12 hours final dry time is seen.
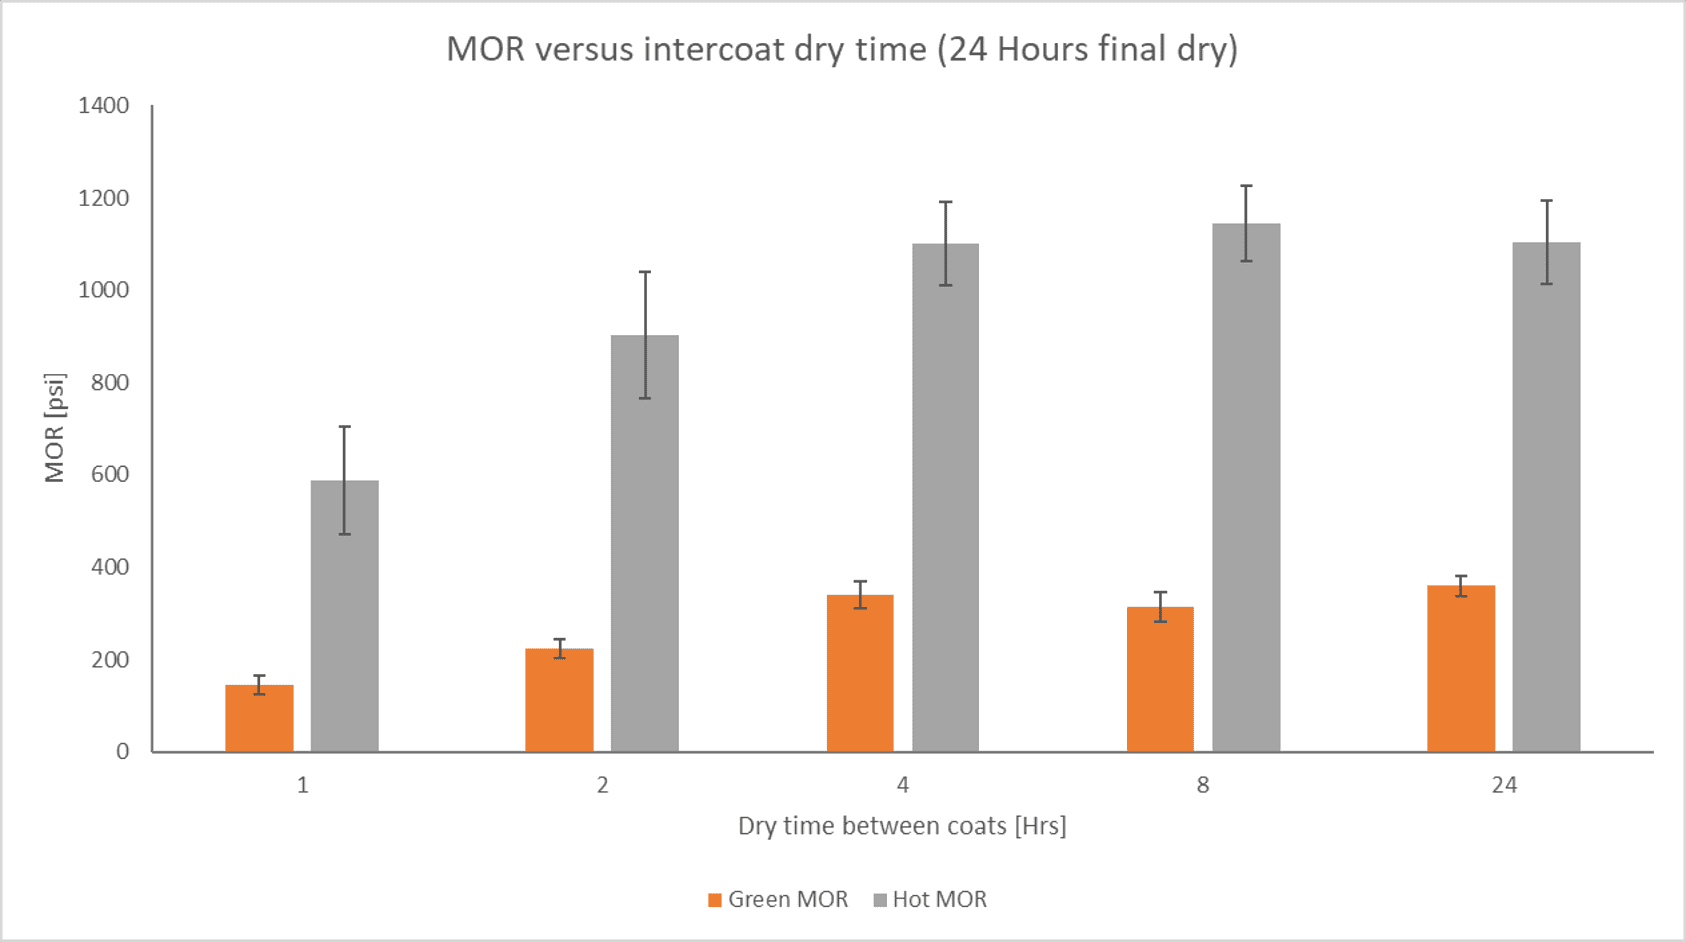 Figure 4 – MOR versus inter coat dry time (24 Hour Dry Time)
The one and two hour dry between dip samples have much lower green and fired strengths than the other, longer dry times. Only the two hour fired bars had strength approaching that of the four hour bars. The lower strengths with the one and two hour dry time systems are because of the incomplete setting of the binder, as they were not completely dry (from Figure 3). As before, Figure 2 shows the amount of difference between the systems using four hours as the control.
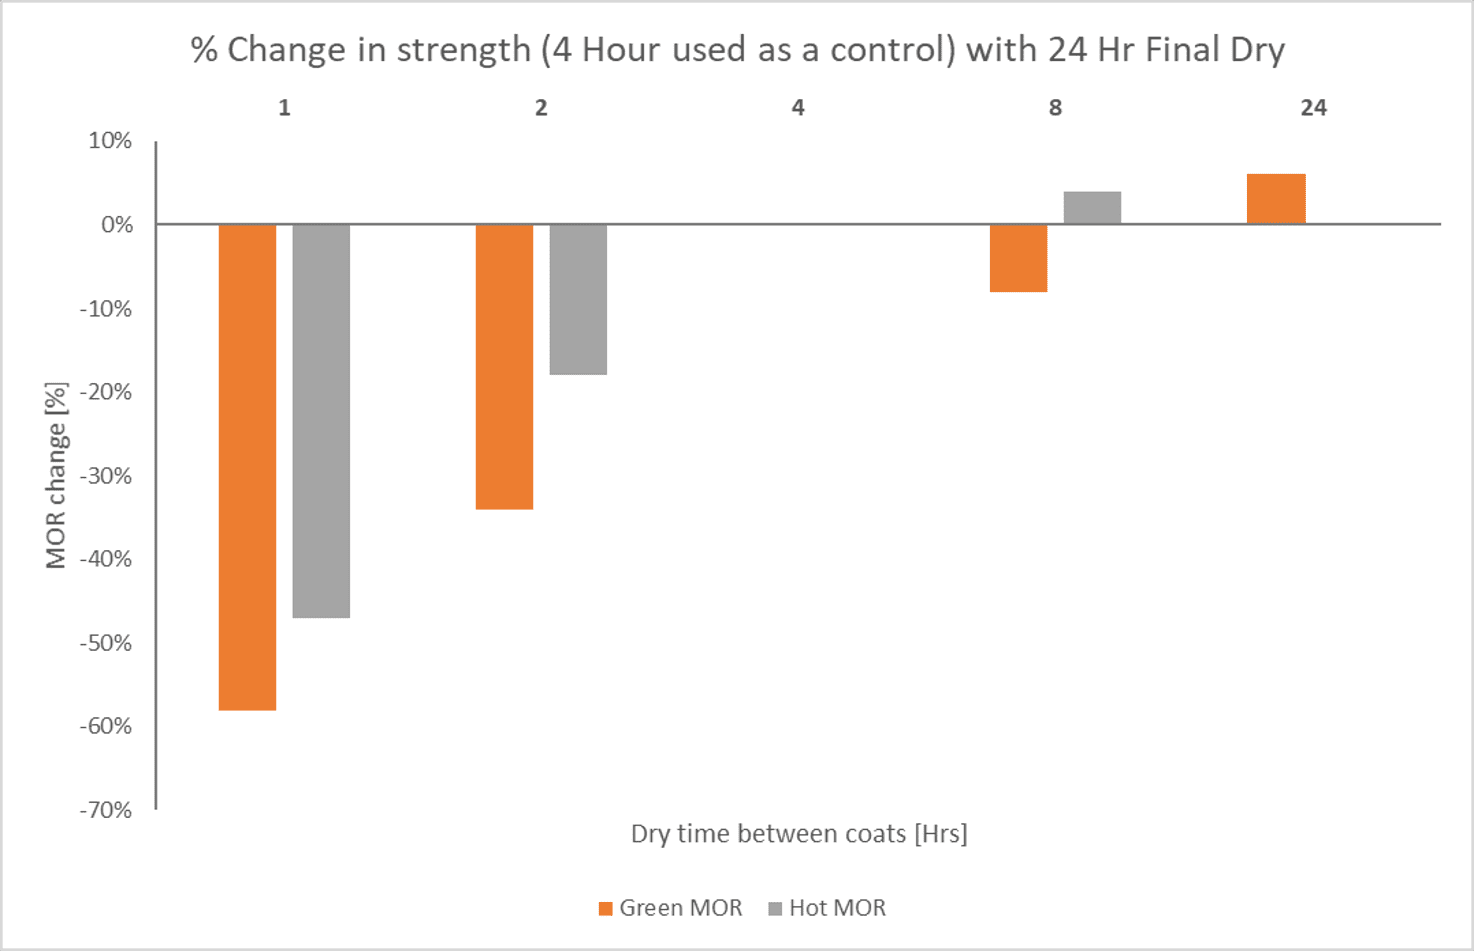 Figure 5 – Percentage change in strength with 24-hour final dry time
It is evident from the above results, that drying for an additional 12 hours does not make up for too short a dry time between dips. For example, at one hour dry between dips, only a 12 psi increase (9%) was noted (green) when samples were dried for 24 hours instead of 12 hours, and no increase was seen in fired MOR.
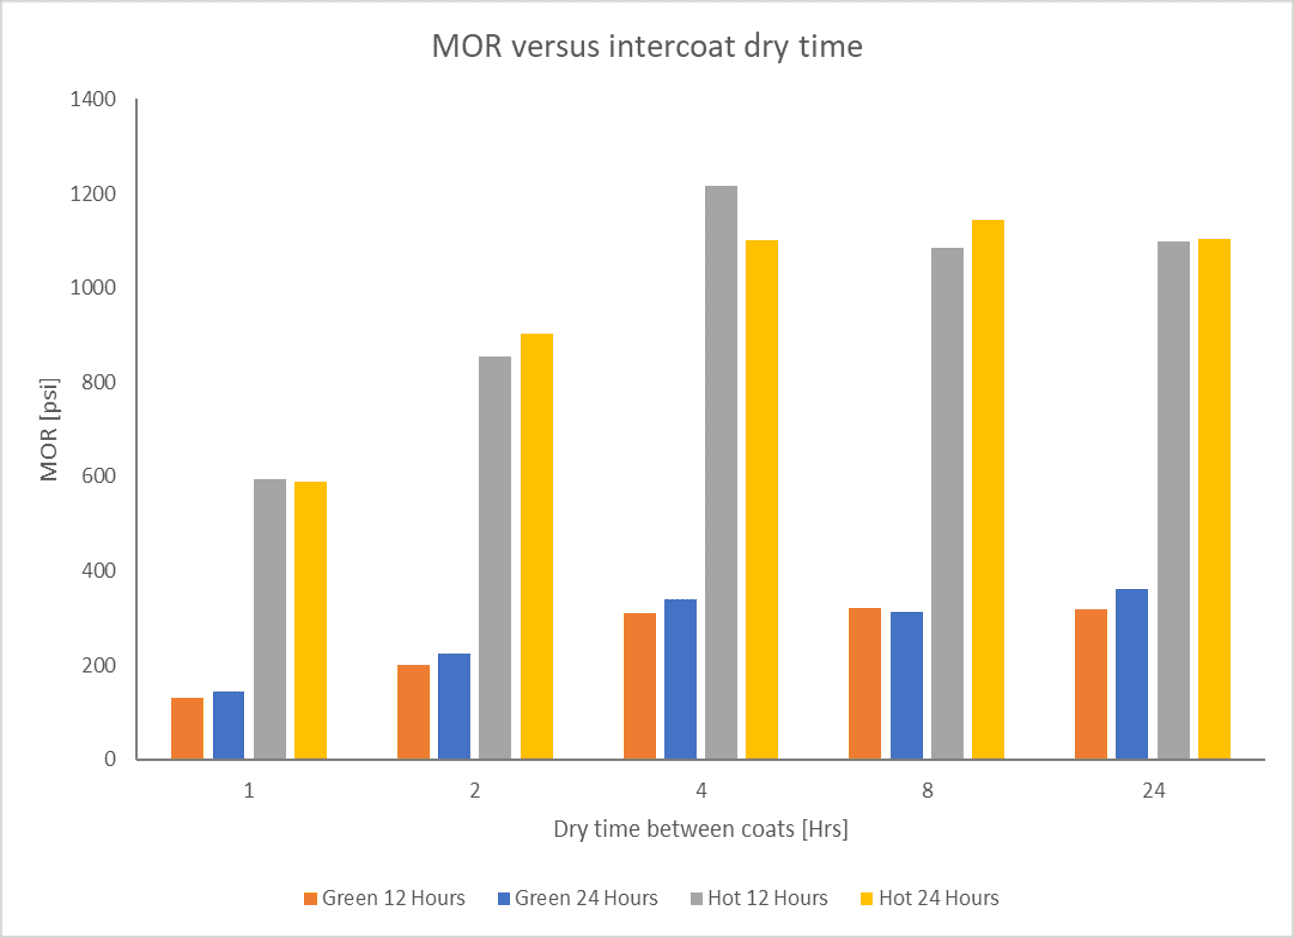 Figure 6 – Comparison of all MOR Data
This is most likely because even though most of the water has been removed from the sample, insufficient bonding occurred because of too fast a dip cycle. Very little extra strength was gained by drying for 24 hours on any of the samples (two of the systems actually had higher strengths at 12 hours). Does this mean that drying for 24 is a waste of time? Not necessarily. When parts are to be steam dewaxed, any residual moisture can be detrimental to the shell because of the large expansion that occurs when water is turned into steam. Drying for longer times may not increase strength, but it reduces the potential for autoclave-related cracking. Also, it should be remembered that the samples run here do not correspond to normal production parts in size or complexity.
CONCLUSIONS
Under the drying conditions used in this study, it was found that dry times of four hours between dips produced maximum or near maximum green and fired modulus of rupture strengths. There was no real difference in strength when samples were dried for 12 or 24 hours after the sealcoat was applied, though it should be noted that the configuration tested, MOR bars, represent a wide open, relatively easy to dry sample.
When insufficient dry time is used (in this experiment, one or two hours between dips), shell strength will be very low. Increasing the final dry time does not make up for the lack of bond strength lost by dipping too rapidly.
Disclaimer
Contact your nearest REMET Sales Office regarding product specifications. Contact your REMET Territory Manager and visit www.remet.com if you have any questions or require additional information.
Information and/or recommendations based on research and technical data believed to be reliable. Offered free of charge for use by persons with technical skills, at their own discretion and risk, without guarantee of accuracy REMET makes no warranties, express or implied, and assumes no liability as to the use of its products or of any information pertaining thereto. Nothing herein is intended as a recommendation to infringe any patent.
< Back to insights