Investment Casting Strength – Part 2: The parameters
In section one we discussed what happens when a sample is subjected to loading under flexural testing and the associated stress distributions. We also touched on the force extension curve which I would like to revisit now. The force/extension curve can tell us a lot about the material. Firstly, it can tell us how strong it is (when it fails) signified by the maximum force before failure, which is then used by Euler’s equation to give you a value of MOR. To do this, measurements of the dimensions of the test piece should be taken. An average of three readings for the thickness and two for the width is advisable. The thickness can be very tricky to measure due to the uneven nature of shell samples and sometimes it is best to “judge” the best places to measure the thickness which is most representative of the sample thickness. A gauge R&R (Repeatability and Reproducibility) study is useful to understand the difference in measurement from operator to operator, however little can be done to reduce this error unfortunately.
The Young’s Modulus can give a vital information on the response of the material to loading. The main features of a stress/strain curve can be found in figure 2.
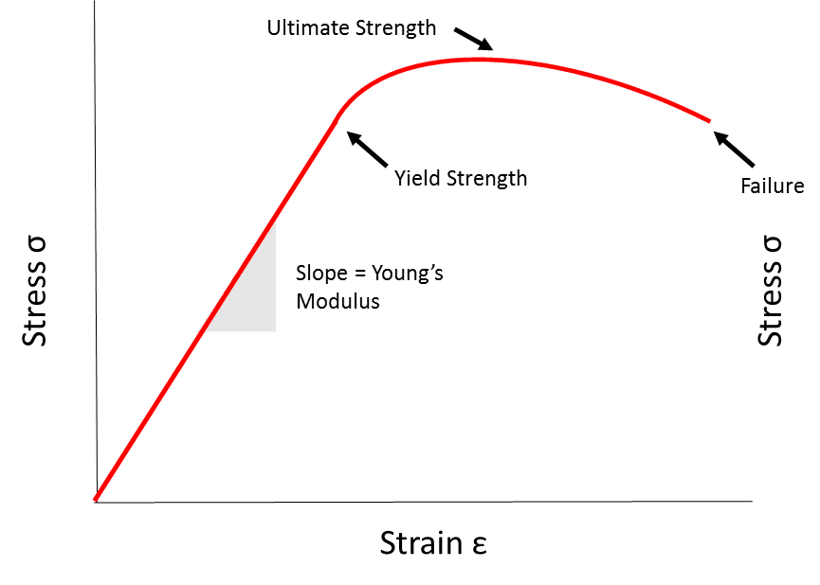
Figure 1 Stress Strain Curve
It defines the relationship between stress, ? (force/cross sectional area) and strain ? (change in length/original length). This allows us to see how elastic the material is and how it strains while under loading. Of course, the higher the young’s modulus, the lower the strain before failure. The Young’s Modulus varies greatly from material to material as indicated in figure 2.

Figure 2 Stress Strain Curve for different materials
The yield stress is the stress at which the elastic properties of the material is exceeded, therefore causing permanent deformation to the material. Before this point the material can flex and return as a spring would do, after this stress is exceeded, the change is irreversible and will therefore not return to its original length. Materials experience necking during loading in tensile testing but we will not discuss this for bending testing which is carried out for wax and shell materials.
For ceramics, very little further strain occurs before brittle failure. Conversely, for waxes, the trend differs on unloading following failure as it is far more ductile than the ceramic as the extension can go on and on and on after failure… This is shown graphically in Figure 3 as a comparison of wax and shell materials.
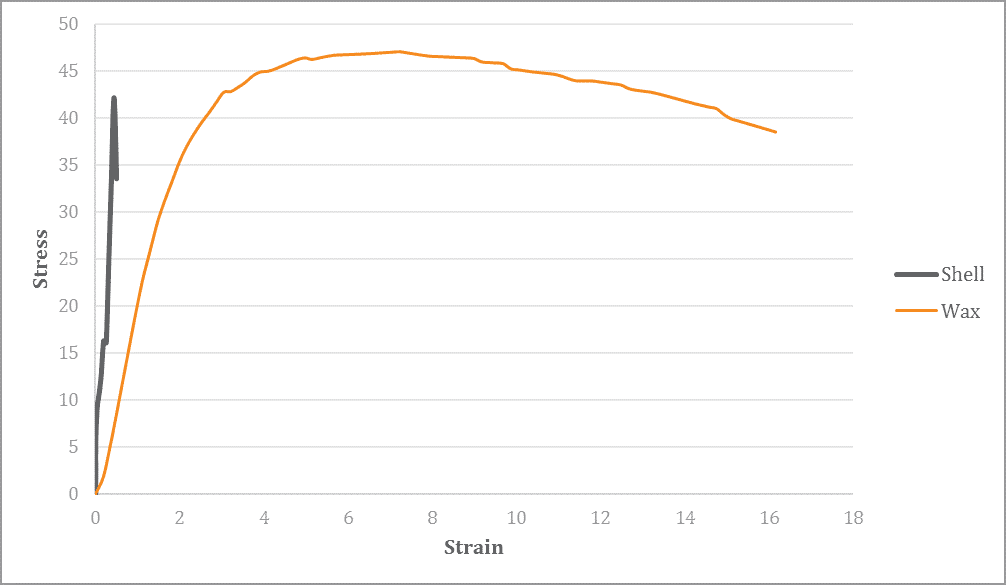
Figure 3 Stress Strain for shell vs wax
The results of these graphs can be useful. They can tell you how much (if any!) your shell can flex before fracture, this is useful throughout the process and can vary according to the polymer content of the slurry during the green state. The Young’s modulus will also tell you the elasticity of the wax with respect to full distortion of the part and whether processing of the part during wax assembly/shelling will distort the part beyond its yield strength, permanently distorting it.
For wax, the stress strain curve can perform elastically however waxes have a melt temperature of between approx. 60 °C and 80 °C and therefore testing the wax at room temperature which has any variation can cause changes with the stress/strain curve also.
The next article is where we get into the properties of these materials and what we want to see during processing. This is where the relationship between strength/elasticity and yield strength gets interesting… We will also revisit the testing setup and stresses as this is pivotal to our understanding of MOR testing. more to follow…
< Back to insights