Use of Statistics in Consumable manufacture and control – Part one – Am I testing this right?
Introduction
I hope I have not lost everybody by the heading of this article!
In the following article series, I decided to review ways in which statistics can be used to better control and test the consumables within the PIC process. As a qualified 6 Sigma Green Belt Engineer, I have seen the benefits of using stats to gain insight into the foundry process to reduce noise, control specifications and improve yield. As Group Technical Director within Remet UK, we similarly use statistics to control consumables so they can perform as required consistently within your process.
Statistics is a daunting subject that can be as easy or difficult as you want. In many cases, it can be used to good effect to understand trends over time or assess differences between (or within!) datasets. In this series, we will present ways in which stats are used within Remet UK and some of the practical uses for this within your process.
Testing
Firstly, we will review what it means when we test a material. In many ways, if our customers or a different lab cannot attain the same results, then the testing cannot be relied upon. When testing samples, there are two items to consider:
- Repeatability – Repeatability is a measure of how many time the samples can be measured the same by the same resource.
- Reproducibility – This is a measure of how different people/machines can measure the same part.
Both the repeatability and reproducibility of testing is key to managing a robust measurement system for testing.
There is also another method of measuring testing of attributes (pass/fail) within a group of samples. This is powerful to assess if resources agree on the pass/fail criteria of defect parts within your process. Conducting an attribute GRR is a powerful tool to health check the inspection criteria in place within your process. Poor results in the analysis of defects within parts shows that there is not alignment between inspectors and indicates the need for retraining.
Gauge R & R Testing in action
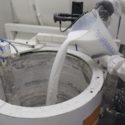
For the purposes of this article, I will concentrate on measurement GRR. Recently we conducted a substantial testing regime for a customer installing new equipment into their process. They were eager to conduct Modulus of Rupture (MOR) testing on samples before and after the change. The MOR testing is a simple test where samples are testing in a test rig and the force required to break them is calculated. The testing overview can be found within figure 1. 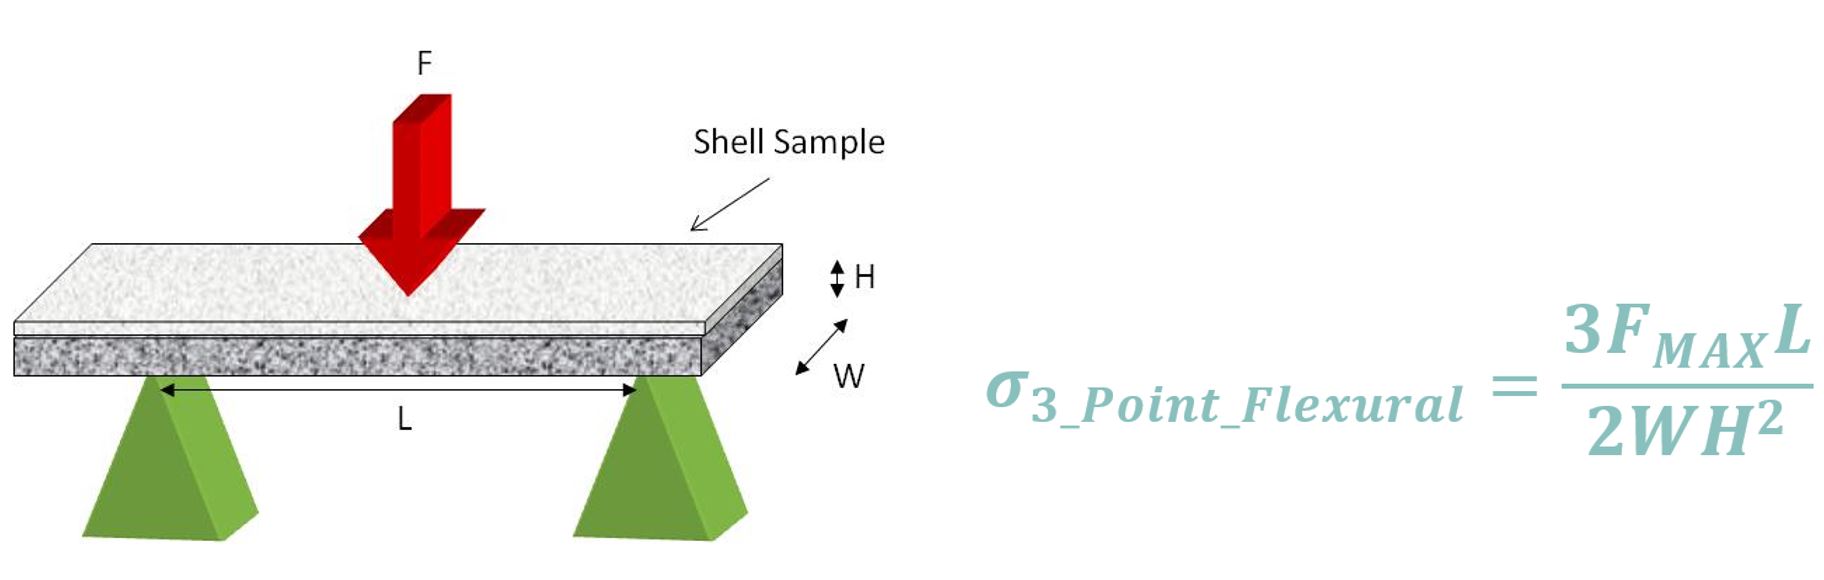 Figure 1 – MOR testing schematic and equation.
As can be seen there is an inverse squared relationship with the thickness which is typically the hardest to measure within a sample.
There were two ways of conducting the GRR, one was to conduct a full GRR utilising the destructive GRR method. This would have required more samples from the customer and more analysis of the dipping and preparation of the samples which was proprietary to them.
In the same way that a fishbone or Ishikawa diagram can be used to find the root cause of issues, we sued it in this scenario to assess the variability within the testing process.
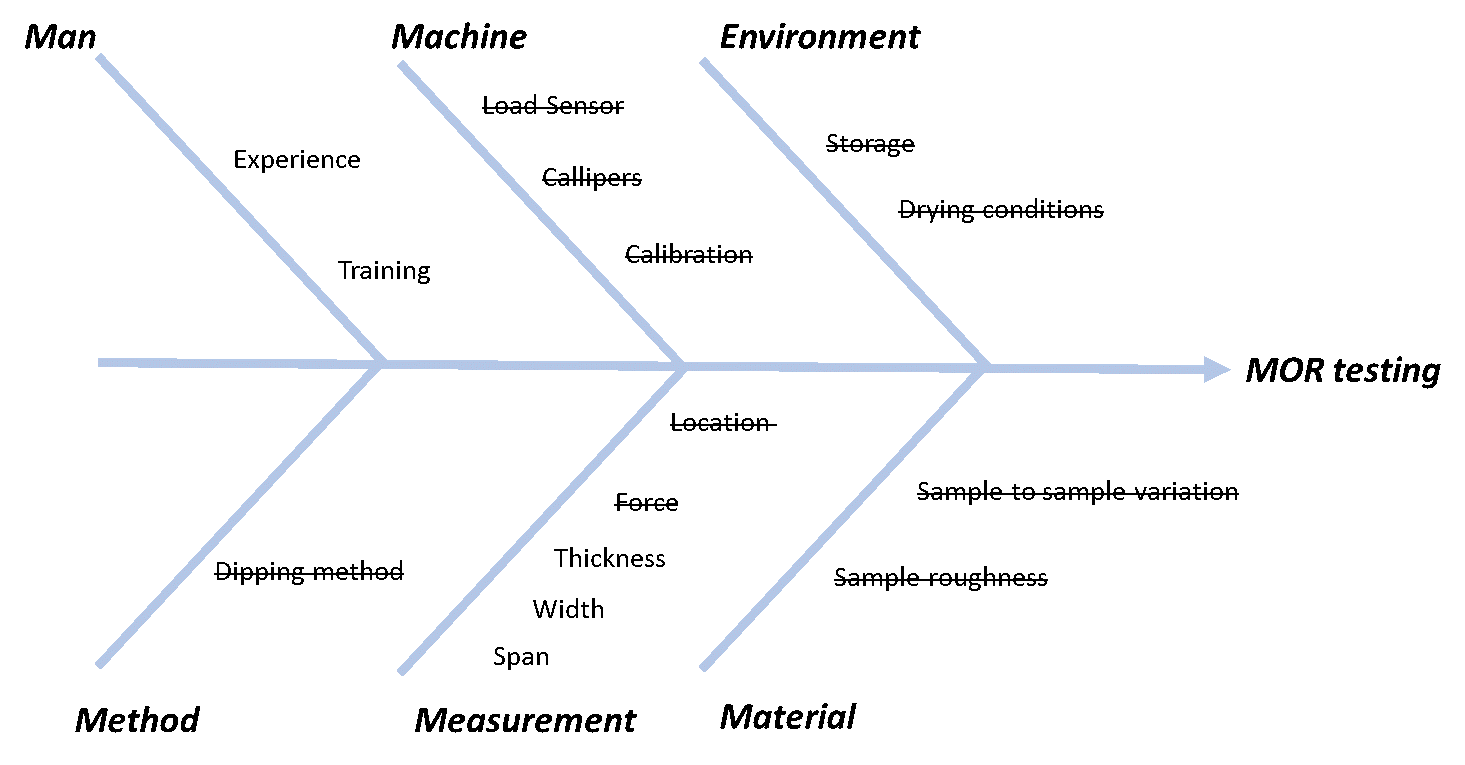 Figure 2 -Ishikawa Diagram of measurement method error
Given the samples were dipped with a machines for all coats, all callipers and load cells were calibrated and drying conditions were kept constant, we concentrated on the measurement of the thickness and width of samples during testing.
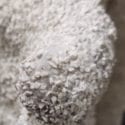
Given the MOR value is reliant on the accurate dimensions of the fractured bar to be given, we decided to conduct our GRR on the measurement method of the bars across a range of different experiences within our lab. The analysis of MOR bars is difficult and subjective due to the uneven nature of the bars as per figure 3.
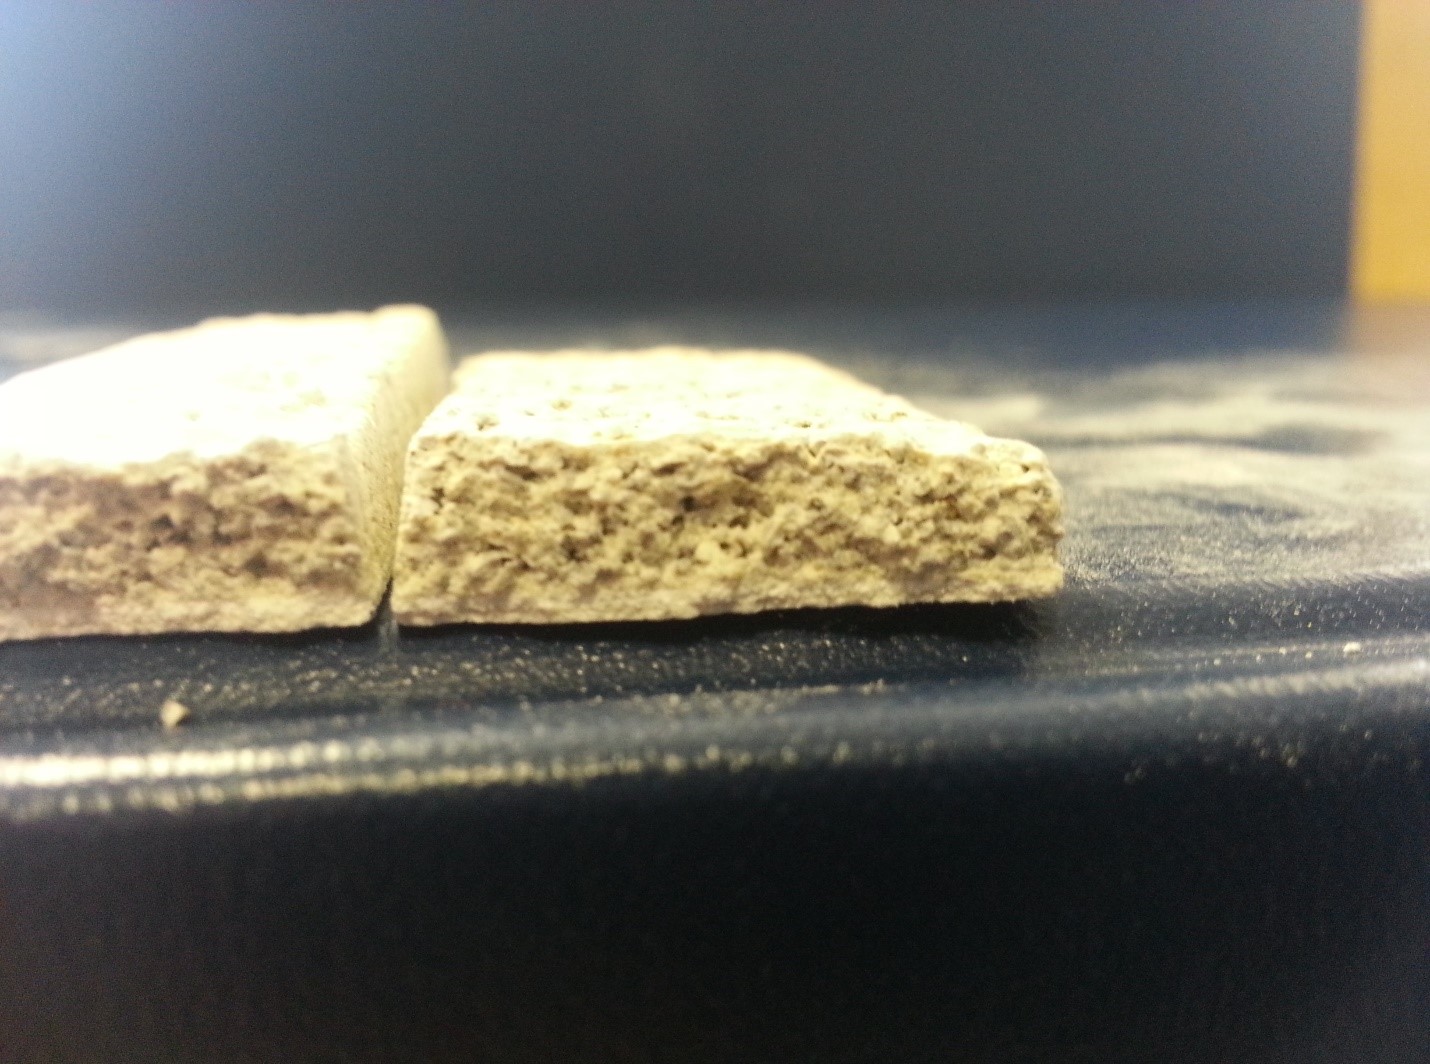 Figure 3 – Typical uneven shells being measured
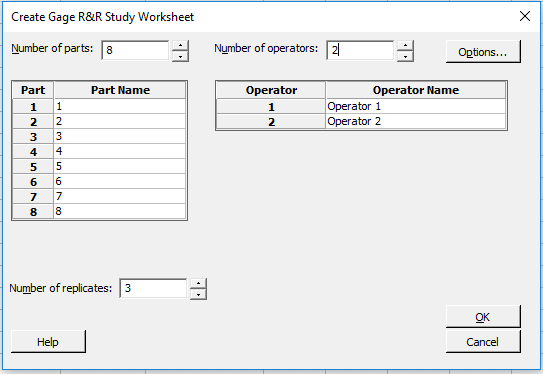
A total of 11 fractured bars and 3 operators were used within the study. Before we go into the results, let us take a step back and outline how the testing was carried out. First we used generated the Create GRR study to generate our table to fill in. Here you can select:
- The number of operators
- The number of samples
- The number of replicates (repeating measurements)
- Whether you randomize the runs (to make sure no trends exist where operators might remember their results)
To conduct the study, we used the same callipers and measured the samples over one day with breaks between measurements of the sample sets. Following this an ANOVA analysis of the GRR was carried out which can be seen below.
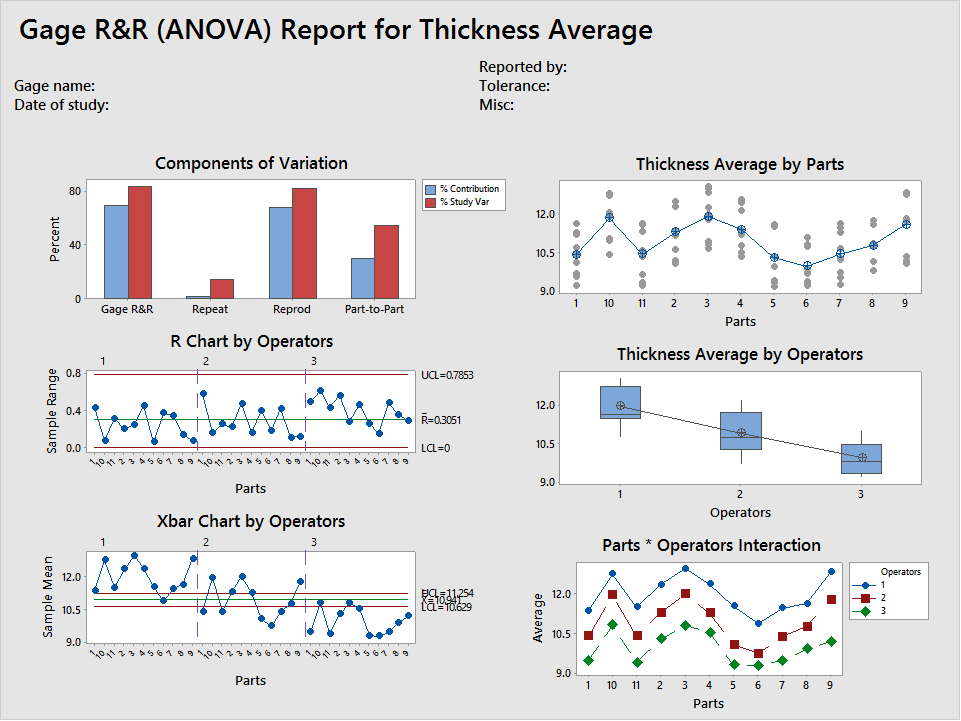
Figure 5 – Minitab Gage R&R study results – Thickness
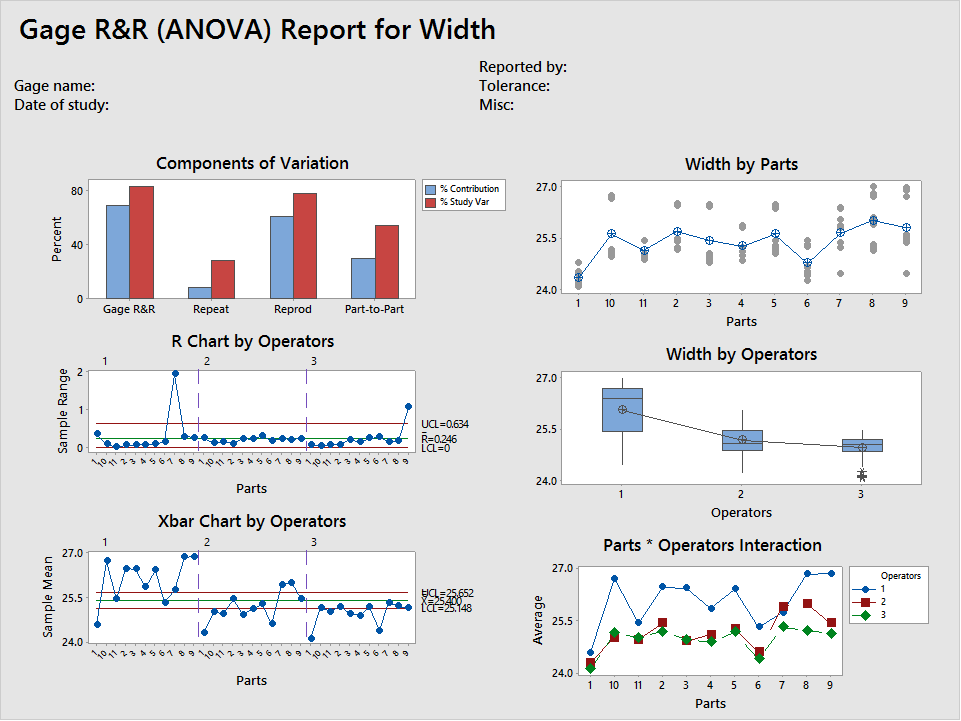
Figure 6 – Minitab Gage R&R study results – width
Within the graphs supplied as part of the analysis, components of variation are useful insights into where the variation in your testing lies. Within our first analysis, the contribution to variation came mostly from reproducibility variation. This showed there was good repeatability within operators, however they did not agree with each other on the measurements. It is desirable that the variation comes from the part to part variation. The number of distinct categories was 1 for this analysis which is poor. This is a measure of the amount of distinct groups your measurement tool can distinguish from the data itself. Typically, a result of over ten is favourable. It is also worth noting our most experienced lab technician had the highest repeatability also!
The R Bar is also an important measure within a GRR study. The range chart, provides insight into the concept of repeatability, ultimately becomes an estimate of the variability component contributed by the measurement process [1]. It is a measure of the differences which can be measured by the measurement technique. Within this analysis, the difference which can be measured for the thickness is 0.33 mm and 0.25 mm for the width. Utilising this within the MOR formula and given typical average thickness, force baselines, we can see the error in the resulting MOR due to dimensional measurement of the sample is as below.
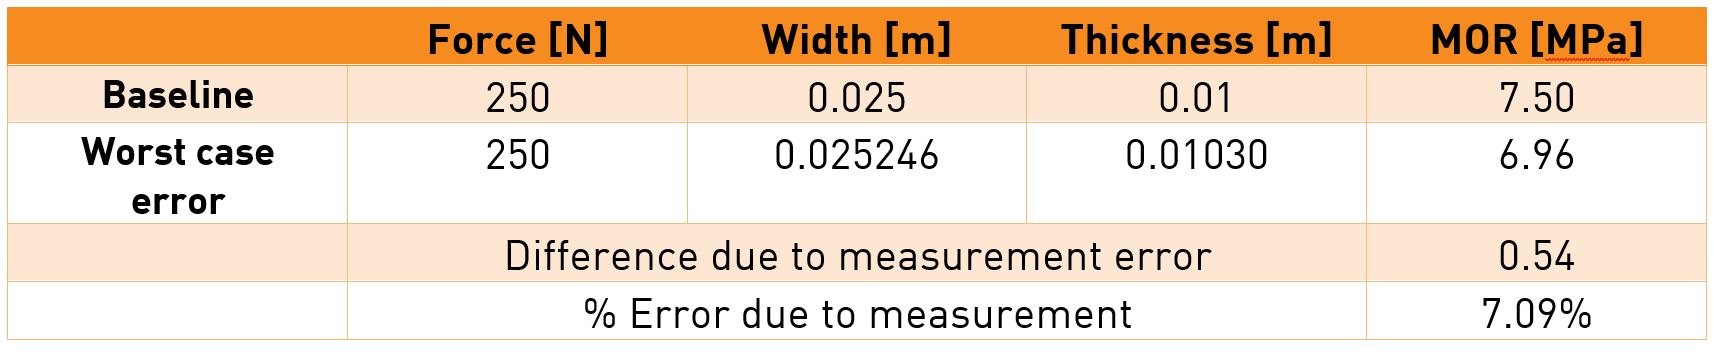
For ceramic shells, error of 7.1% is acceptable as ceramics are notoriously difficult to measure accurately. However, as this was only a measurement of the dimensional measurement error within an MOR experiment, more error will be present due to other contributors. Therefore, it was decided to retrain and conduct more testing.
The results below are following a period of retraining and realignment of test method. For the 2nd study 8 bars were measured across the same 3 operators and the results can be found below.
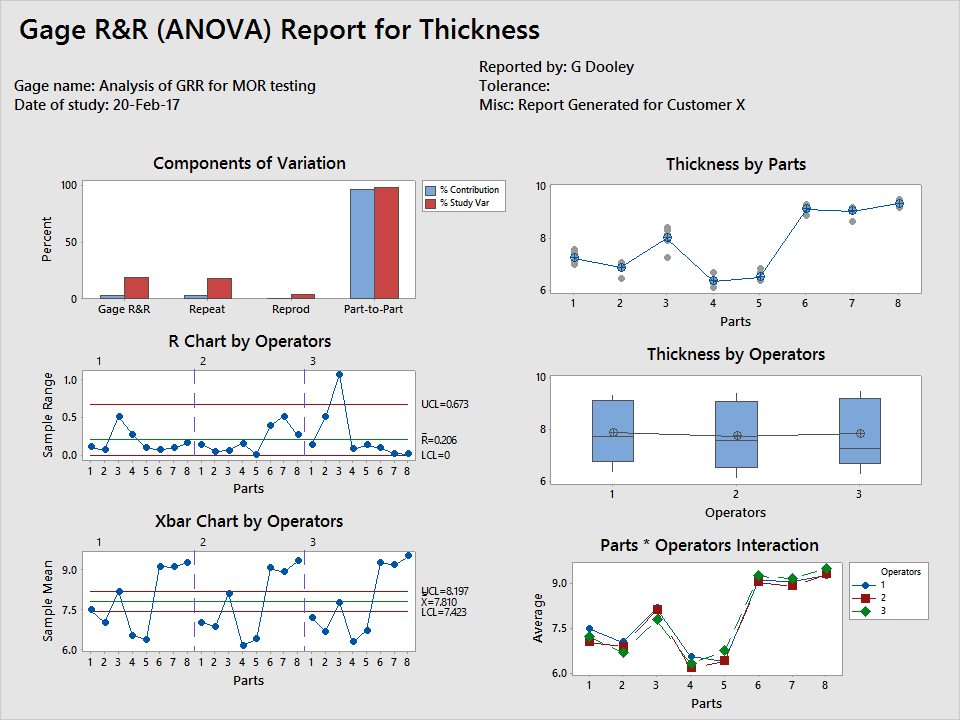
Figure 7 – 2nd Minitab Gage R&R study results – thickness

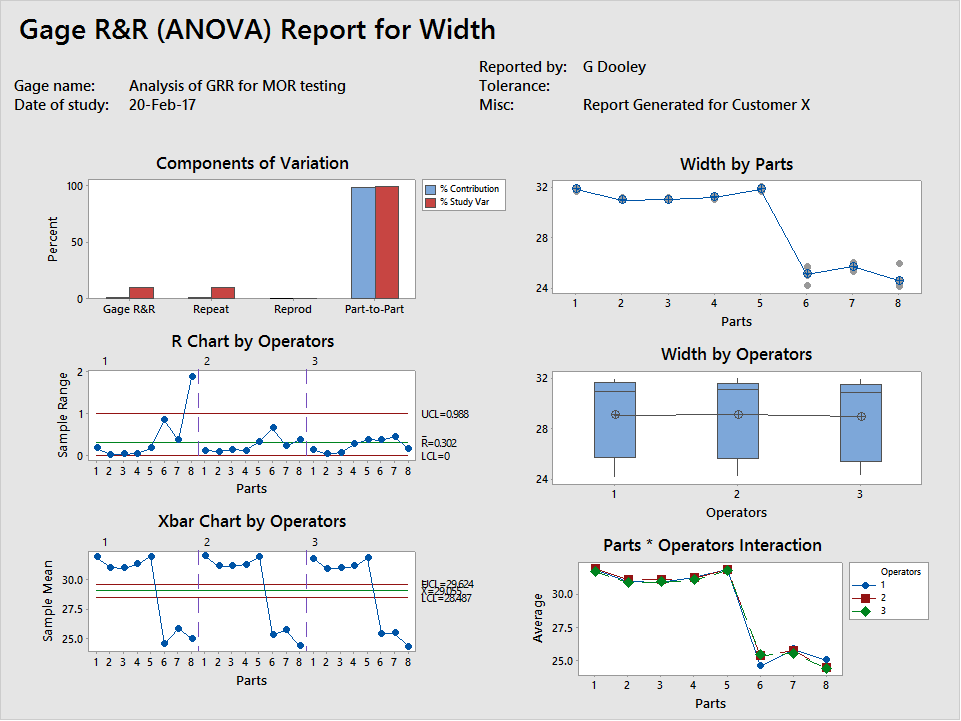
Figure 8 – 2nd Minitab Gage R&R study results – width
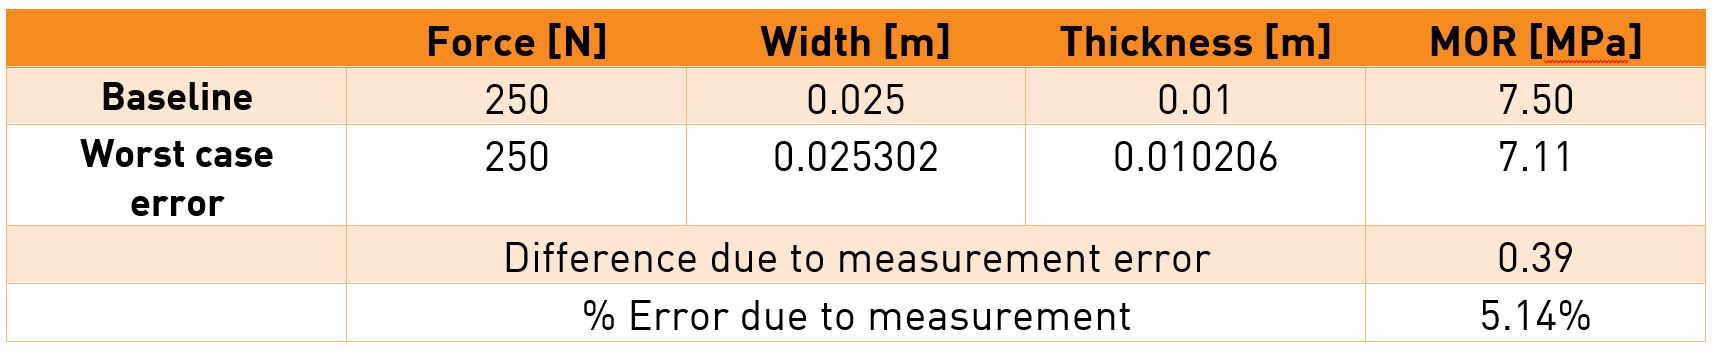
Following retraining, the variability of the MOR reduced the measurements error by 2%. The number of distinct categories increased from 1 to 13 also.
Conclusion
As can be seen, the use of a GRR study can be a strong tool to assess differences in the measurement method of parts. Within our technical service department, we strive to improve our testing methods constantly and ensure what we measure is repeatable and reproducible.
References
[1] Evaluating the Measurement Process, Wheeler, Donald J., Lyday, Richard W.
Disclaimer
Contact your nearest REMET Sales Office regarding product specifications.
Contact your REMET Territory Manager and visit www.remet.com if you have any questions or require additional information.
Information and/or recommendations based on research and technical data believed to be reliable. Offered free of charge for use by persons with technical skills, at their own discretion and risk, without guarantee of accuracy REMET makes no warranties, express or implied, and assumes no liability as to the use of its products or of any information pertaining thereto. Nothing herein is intended as a recommendation to infringe any patent.
< Back to insights